Press Releases
Euroseas Ltd. Reports Results for the Year and Quarter Ended December 31, 2016
Maroussi, Athens, Greece - February 16, 2017 - Euroseas Ltd. (NASDAQ: ESEA) (the "Company" or "Euroseas"), an owner and operator of drybulk and container carrier vessels and provider of seaborne transportation for drybulk and containerized cargoes, announced today its results for the three month period and full year ended December 31, 2016.
Fourth Quarter 2016 Highlights:
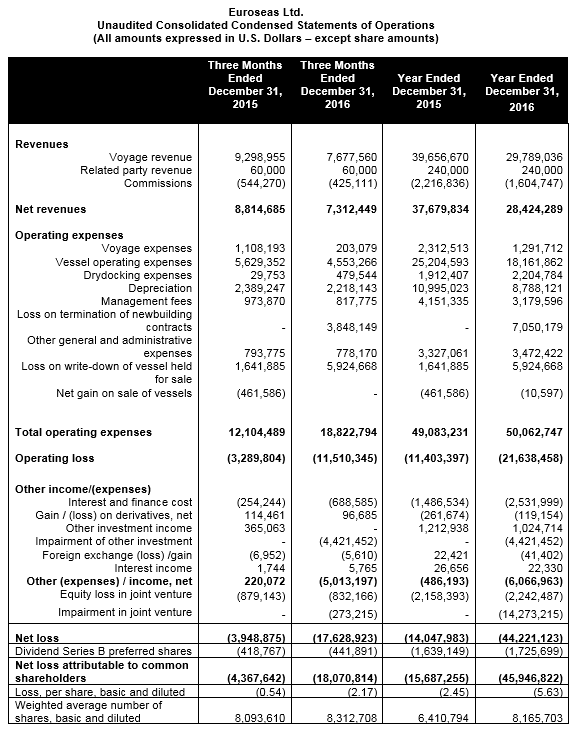
• Total net revenues of $7.3 million. Net loss attributable to common shareholders of $18.1 million or $2.17 loss per share basic and diluted. This loss includes, amongst other items, a $0.4 million of dividend on Series B Preferred Shares, a $5.9 million loss on write-down of M/V Eleni which was held for sale, $3.8 million loss on expected termination of our Kamsarmax newbuilding contract and a $4.7 million impairment loss in our "Other investment" and "Investment in joint venture" ("Euromar investments"). Adjusted net loss attributable to common shareholders1 for the period was $3.7 million or $0.45 loss per share basic and diluted.
• Adjusted EBITDA1 was $(0.4) million.
• An average of 12.1 vessels were owned and operated during the fourth quarter of 2016 earning an average time charter equivalent rate of $7,666 per day.
• The Company declared its twelfth dividend of $0.4 million on its Series B Preferred Shares; the dividend was paid in-kind by issuing additional Series B Preferred Shares.
Full year 2016 Highlights:
• Total net revenues of $28.4 million. Net loss attributable to common shareholders of $45.9 million or $5.63 loss per share basic and diluted. This loss includes, among other items, a $1.7 million of dividend on Series B Preferred Shares, a $5.9 million loss on write-down of M/V Eleni which was held for sale, $7.1 million loss on termination of our Ultramax newbuilding contracts and on expected termination of our Kamsarmax newbuilding contract and a $18.7 million impairment loss in our Euromar investments. Adjusted net loss attributable to common shareholders1 for the period was $14.2 million or $1.74 loss per share basic and diluted.
• Adjusted EBITDA1 was $(1.1) million.
• An average of 11.52 vessels were owned and operated during the twelve months of 2016 earning an average time charter equivalent rate of $7,331 per day.
1 Adjusted EBITDA, Adjusted net loss and Adjusted loss per share are not recognized measurements under GAAP. Refer to a subsequent section of the Press Release for the definitions and reconciliation of these measurements to the most directly comparable financial measures calculated and presented in accordance with U.S. GAAP.
As previously announced, the Company:
• Took delivery of its Ultramax newbuilding, M/V Alexandros P, and the Panamax vessel, M/V Tasos in January 2017; also, completed the sale of M/V Eleni P and, in February 2017, sold M/V RT Dagr.
• Drew a $10.9 million loan collateralized by its new vessel, M/V Alexandros P.
• Sold to date approximately 1.28 million shares raising about $2.7 million of net proceeds through its at-the-market ("ATM") stock offering.
Aristides Pittas, Chairman and CEO of Euroseas, commented: "During the last quarter of 2016 and the month of January of 2017, we were able to transform the company by resolving its liquidity needs through a combination of equity raisings (through our at-the-market equity program, the contribution of a vessel that was scrapped and a private placement of our common stock), debt rescheduling and new financings. In addition, we added a further drybulk newbuilding to our fleet and replaced certain older vessels with slightly younger ones. We believe all of these steps help position Euroseas to benefit from a potential market recovery. Our fleet now includes two drybulk newbuilding vessels; at the same time, we have no remaining capital commitments since we can opt out of our Kamsarmax newbuilding contract by end of March 2017. We also face a low loan repayment burden in 2017."
"Looking forward, we could see a gradual improvement in the drybulk market if China's commodity appetite continues as supply pressures are expected to subside in the second half of 2017. We are hopeful to also see an improvement in the containership rates on the back of supply correction (increased scrapping and more slippage in new deliveries)."
"We now have the financial capacity to pursue selected acquisitions and take advantage of opportunities to invest while the prices of vessels are still relatively low. And we hope we will be able to continue acting as a platform to consolidate other ownership interests using our stock to pay for acquisitions such as the recent acquisition of M/V RT Dagr."
Tasos Aslidis, Chief Financial Officer of Euroseas, commented: "The operating results of the fourth quarter of 2016 reflect the continuing low level of charter rates in the containership market and the modestly improved (especially during November 2016) drybulk market during the quarter. On average during the fourth quarter of 2016, our vessels earned 0.7% per day per vessel less than in the fourth quarter of 2015."
"Total daily vessel operating expenses, including management fees, general and administrative expenses, but excluding drydocking costs, decreased approximately 3.8% during the fourth quarter of 2016 compared to the same quarter of last year, while for the full year 2016 the decrease was approximately 3.1%. As always, we want to emphasize that cost control remains a key component of our strategy, especially at depressed markets like at present."
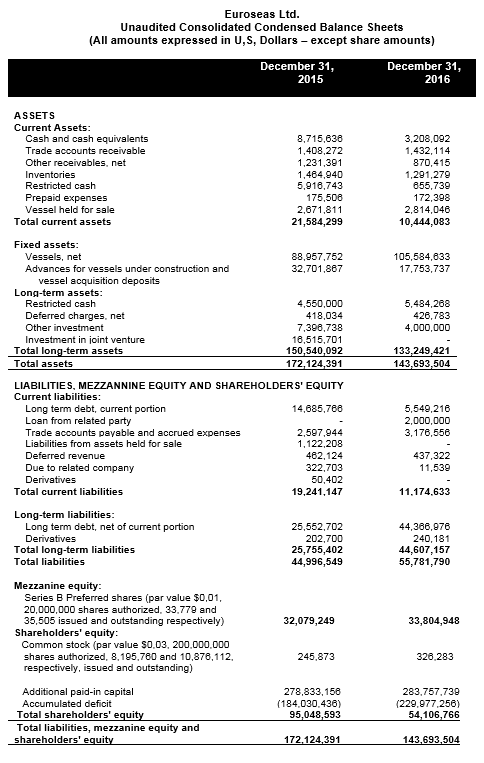
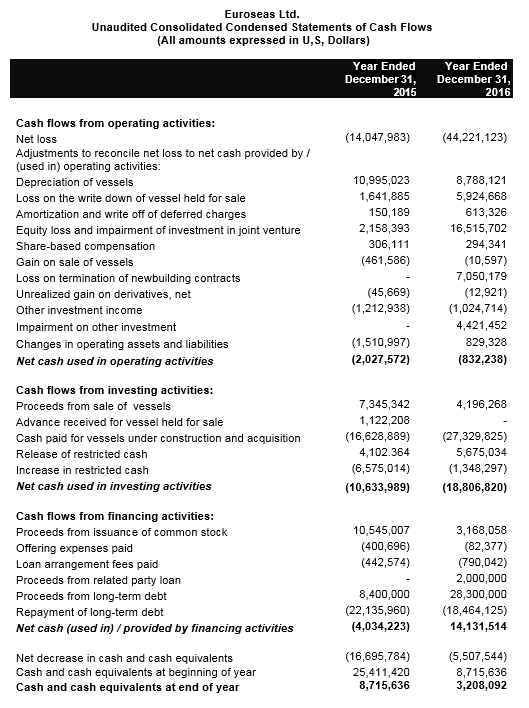
"As of December 31, 2016, our outstanding debt was $52.4 million versus restricted and unrestricted cash of approximately $9.3 million. We complied with all our debt covenants as of December 31, 2016."
Fourth Quarter 2016 Results:
For the fourth quarter of 2016, the Company reported total net revenues of $7.3 million representing a 17.0% decrease over total net revenues of $8.8 million during the fourth quarter of 2015. The Company reported a net loss for the period of $17.6 million and a net loss attributable to common shareholders of $18.1 million, as compared to a net loss of $3.9 million and net loss attributable to common shareholders of $4.4 million for the fourth quarter of 2015. On average, 12.1 vessels were owned and operated during the fourth quarter of 2016 earning an average time charter equivalent rate of $7,666 per day compared to 13.97 vessels in the same period of 2015 earning an average time charter equivalent rate of $7,717 per day.
Depreciation expenses for the fourth quarter of 2016 were $2.2 million, compared to the $2.4 million for the same period of 2015. The results for the fourth quarter of 2016 include a $0.1 million net gain on derivatives, a $5.9 million loss on write-down of vessel held for sale, a $3.8 million loss on termination of a newbuilding contract and a $4.7 million impairment loss in other investment and investment in joint venture as compared to a $0.1 million net gain on derivatives, and a $1.2 million net loss resulting from gains on sale of vessels and loss on write-down of vessel held for sale for the same period of 2015.
Adjusted EBITDA for the fourth quarter of 2016 was $(0.4), million compared to $(0.2) million for the same of the fourth quarter of 2015. Please see below for Adjusted EBITDA reconciliation to net loss and cash flow provided by operating activities.
Basic and diluted loss per share attributable to common shareholders for the fourth quarter of 2016 was $2.17 calculated on 8,312,708 basic and diluted weighted average number of shares outstanding, compared to basic and diluted loss per share of $0.54 for the fourth quarter of 2015, calculated on 8,093,610 basic and diluted weighted average number of shares outstanding.
Excluding the effect on the loss attributable to common shareholders for the quarter of the net gain on derivatives, the net gain on sale of vessels, the loss on write-down of vessel held for sale, the loss on termination of a newbuilding contract and impairment loss in other investment and investment in joint venture, the adjusted net loss per share attributable to common shareholders for the quarter ended December 31, 2016 would have been $0.45 per share basic and diluted compared to net loss of $0.41 per share basic and diluted for the quarter ended December 31, 2015. Usually, security analysts do not include the above items in their published estimates of earnings per share.
Full Year 2016 Results:
For the full year of 2016, the Company reported total net revenues of $28.4 million representing a 24.6% decrease over total net revenues of $37.7 million during the twelve months of 2015. The Company reported a net loss for the period of $44.2 million and a net loss attributable to common shareholders of $45.9 million, as compared to a net loss of $14.0 million and a net loss attributable to common shareholders $15.7 million for the twelve months of 2015. On average, 11.52 vessels were owned and operated during 2016 earning an average time charter equivalent rate of $7,331 per day compared to 14.74 vessels in the same period of 2015 earning on average $7,570 per day.
Depreciation expenses for 2016 were $8.8 million compared to $11.0 million during the same period of 2015. The results for the twelve months of 2016 include a $0.1 million net loss on derivatives, a $5.9 million loss on write-down of vessel held for sale, a $7.1 million loss on termination of newbuilding contracts and a $18.7 million impairment loss in other investment and investment in joint venture, as compared to a $0.3 million net loss on derivatives and a $1.2 million net loss resulting from gains on sale of vessels and loss on write-down of vessel held for sale for the same period of 2015.
Adjusted EBITDA for 2016 was $(1.1) million decreasing from the ($0.2) million recorded during 2015. Please see below for Adjusted EBITDA reconciliation to net loss and cash flow provided by operating activities.
Basic and diluted loss per share attributable to common shareholders for 2016 was $5.63 calculated on 8,165,703 basic and diluted weighted average number of shares outstanding, compared to basic and diluted loss per share of $2.45 for 2015, calculated on 6,410,794 basic and diluted weighted average number of shares outstanding.
Excluding the effect on the loss attributable to common shareholders of the net loss on derivatives, the net gain on sale of vessels and loss on write-down of vessel held for sale, the loss on termination of newbuilding contracts and impairment loss in other investment and investment in joint venture, the adjusted net loss per share attributable to common shareholders for 2016 would have been $1.74 compared to a loss of $2.22 per share basic and diluted for 2015. Usually, security analysts do not include the above items in their published estimates of earnings per share.
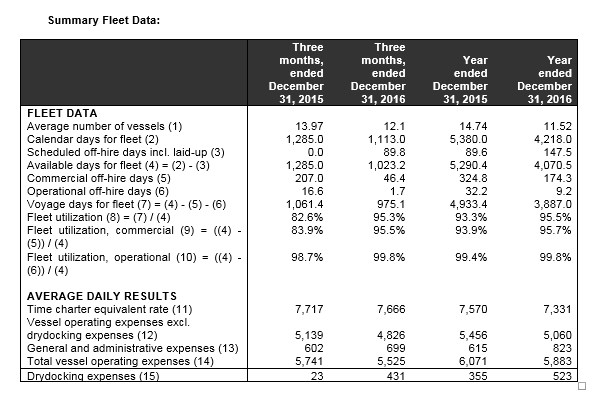
(1) Average number of vessels is the number of vessels that constituted the Company's fleet for the relevant period, as measured by the sum of the number of calendar days each vessel was a part of the Company's fleet during the period divided by the number of calendar days in that period.
(2) Calendar days. We define calendar days as the total number of days in a period during which each vessel in our fleet was in our possession including off-hire days associated with major repairs, drydockings or special or intermediate surveys or days of vessels in lay-up. Calendar days are an indicator of the size of our fleet over a period and affect both the amount of revenues and the amount of expenses that we record during that period.
(3) The scheduled off-hire days including vessels laid-up are days associated with scheduled repairs, drydockings or special or intermediate surveys or days of vessels in lay-up.
(4) Available days. We define available days as the total number of days in a period during which each vessel in our fleet was in our possession net of scheduled off-hire days. We use available days to measure the number of days in a period during which vessels were available to generate revenues.
(5) Commercial off-hire days. We define commercial off-hire days as days waiting to find employment.
(6) Operational off-hire days. We define operational off-hire days as days associated with unscheduled repairs or other off-hire time related to the operation of the vessels.
(7) Voyage days. We define voyage days as the total number of days in a period during which each vessel in our fleet was in our possession net of commercial and operational off-hire days. We use voyage days to measure the number of days in a period during which vessels actually generate revenues.
(8) Fleet utilization. We calculate fleet utilization by dividing the number of our voyage days during a period by the number of our available days during that period. We use fleet utilization to measure a company's efficiency in finding suitable employment for its vessels and minimizing the amount of days that its vessels are off-hire for reasons such as unscheduled repairs or days waiting to find employment.
(9) Fleet utilization, commercial. We calculate commercial fleet utilization by dividing our available days net of commercial off-hire days during a period by our available days during that period.
(10) Fleet utilization, operational. We calculate operational fleet utilization by dividing our available days net of operational off-hire days during a period by our available days during that period.
(11) Time charter equivalent, or TCE, is a measure of the average daily revenue performance of a vessel on a per voyage basis. Our method of calculating TCE is determined by dividing revenue generated from voyage charters net of voyage expenses by voyage days for the relevant time period. Voyage expenses primarily consist of port, canal and fuel costs that are unique to a particular voyage, which would otherwise be paid by the charterer under a time charter contract. TCE is a standard shipping industry performance measure used primarily to compare period-to-period changes in a shipping company's performance despite changes in the mix of charter types (i.e., spot voyage charters, time charters and bareboat charters) under which the vessels may be employed between the periods.
(12) Daily vessel operating expenses, which includes crew costs, provisions, deck and engine stores, lubricating oil, insurance, maintenance and repairs and management fees are calculated by dividing vessel operating expenses by fleet calendar days for the relevant time period. Drydocking expenses are reported separately.
(13) Daily general and administrative expense is calculated by dividing general and administrative expense by fleet calendar days for the relevant time period.
(14) Total vessel operating expenses, or TVOE, is a measure of our total expenses associated with operating our vessels. TVOE is the sum of vessel operating expenses excluding drydocking expenses and general and administrative expenses. Daily TVOE is calculated by dividing TVOE by fleet calendar days for the relevant time period.
(15) Drydocking expenses, which include expenses during drydockings that would have been capitalized and amortized under the deferral method divided by the fleet calendar days for the relevant period. Drydocking expenses could vary substantially from period to period depending on how many vessels underwent drydocking during the period.
Conference Call and Webcast:
Later today, Thursday, February 16, 2017 at 10:30 a.m. EST, the company's management will host a conference call to discuss the results.
Conference Call details:
Participants should dial into the call 10 minutes before the scheduled time using the following numbers: 1 (866) 819-7111 (from the US), 0(800) 953-0329 (from the UK) or (+44) (0) 1452 542 301 (from outside the US). Please quote "Euroseas."
A replay of the conference call will be available until Thursday, February 23, 2017. The United States replay number is 1(866) 247-4222; from the UK 0(800) 953-1533; the standard international replay number is (+44) (0) 1452 550 000 and the access code required for the replay is: 6973591#.
Audio Webcast - Slides Presentation:
There will be a live and then archived audio webcast of the conference call, via the internet through the Euroseas website (www.euroseas.gr). Participants to the live webcast should register on the website approximately 10 minutes prior to the start of the webcast.
The slide presentation on the fourth quarter ended December 31, 2016, will also be available in PDF format 10 minutes prior to the conference call and webcast, accessible on the company's website (www.euroseas.gr) on the webcast page. Participants to the webcast can download the PDF presentation.
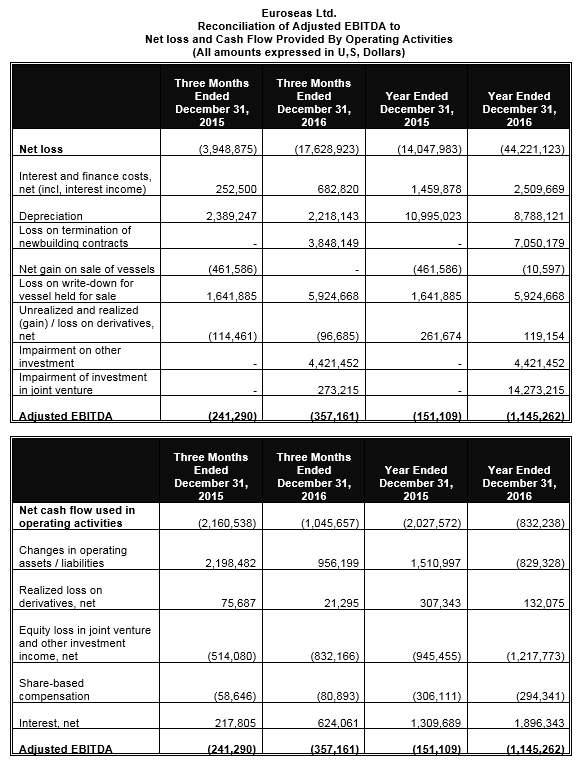
Adjusted EBITDA Reconciliation: Euroseas Ltd. considers Adjusted EBITDA to represent net earnings / (loss) before interest, income taxes, depreciation, amortization, gain / loss in derivatives and loss on termination of a newbuilding contracts, loss on write down of vessel held for sale, impairment of investment in joint venture, net gain on sale of vessels and impairment on other investment. Adjusted EBITDA does not represent and should not be considered as an alternative to net income /(loss) or cash flow from operations, as determined by United States generally accepted accounting principles, or U.S. GAAP, and the Company's calculation of Adjusted EBITDA may not be comparable to that reported by other companies. Adjusted EBITDA is included herein because it is a basis upon which the Company assesses its financial performance and liquidity position and because the Company believes that it presents useful information to investors regarding a company's ability to service and/or incur indebtedness. The Company's definition of Adjusted EBITDA may not be the same as that used by other companies in the shipping or other industries.
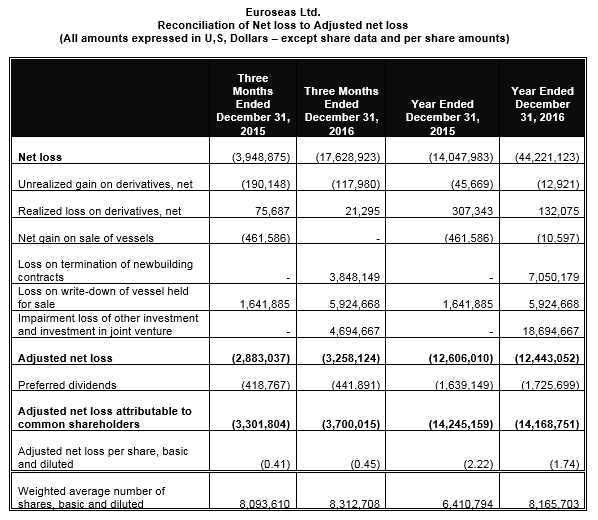
"Adjusted net loss" and "Adjusted net loss per share" Reconciliation: Euroseas Ltd. considers "Adjusted net loss" to represent net loss before gain / loss on derivatives, loss on termination of new building contract and gain on sale of a vessel. "Adjusted net loss" and "Adjusted net loss per share" is included herein because we believe it assists our management and investors by increasing the comparability of the Company's fundamental performance from period to period by excluding the potentially disparate effects between periods of gain / loss on derivatives, loss on termination of newbuilding contracts, gain on sale of a vessel and impairment of investment in joint venture, which items may significantly affect results of operations between periods.
"Adjusted Net loss" and "Adjusted net loss per share" do not represent and should not be considered as an alternative to net loss or loss per share, as determined by U.S. GAAP. The Company's definition of "Adjusted net loss" and "Adjusted net loss per share" may not be the same as that used by other companies in the shipping or other industries.
About Euroseas Ltd.
Euroseas Ltd. was formed on May 5, 2005 under the laws of the Republic of the Marshall Islands to consolidate the ship owning interests of the Pittas family of Athens, Greece, which has been in the shipping business over the past 140 years. Euroseas trades on the NASDAQ Capital Market under the ticker ESEA.
Euroseas operates in the dry cargo, drybulk and container shipping markets. Euroseas' operations are managed by Eurobulk Ltd., an ISO 9001:2008 certified affiliated ship management company which is responsible for the day-to-day commercial and technical management and operations of the vessels. Euroseas employs its vessels on spot and period charters and through pool arrangements.
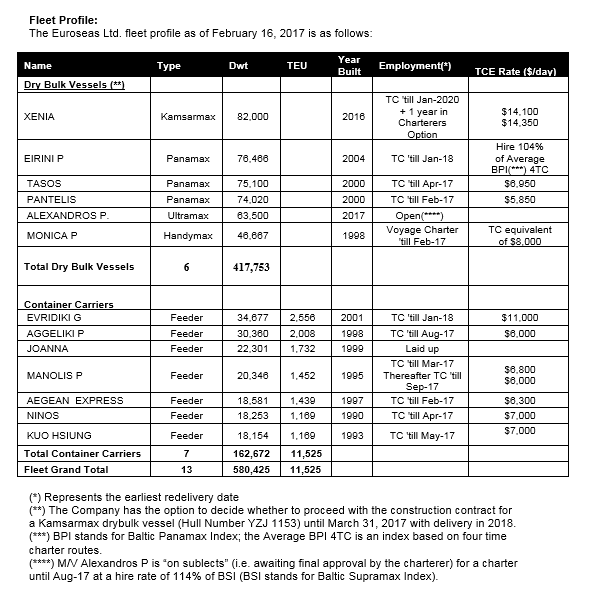
The Company has a fleet of 13 vessels, including one Kamsarmax drybulk carrier, three Panamax drybulk carriers, one Ultramax drybulk carrier, one Handymax drybulk carrier, and seven Feeder containerships. Euroseas six drybulk carriers have a total cargo capacity of 417,753 dwt, its seven containerships have a cargo capacity of 11,525 teu.
Forward Looking Statement
This press release contains forward-looking statements (as defined in Section 27A of the Securities Act of 1933, as amended, and Section 21E of the Securities Exchange Act of 1934, as amended) concerning future events and the Company's growth strategy and measures to implement such strategy; including expected vessel acquisitions and entering into further time charters. Words such as "expects," "intends," "plans," "believes," "anticipates," "hopes," "estimates," and variations of such words and similar expressions are intended to identify forward-looking statements. Although the Company believes that the expectations reflected in such forward-looking statements are reasonable, no assurance can be given that such expectations will prove to have been correct. These statements involve known and unknown risks and are based upon a number of assumptions and estimates that are inherently subject to significant uncertainties and contingencies, many of which are beyond the control of the Company. Actual results may differ materially from those expressed or implied by such forward-looking statements. Factors that could cause actual results to differ materially include, but are not limited to changes in the demand for dry bulk vessels and container ships, competitive factors in the market in which the Company operates; risks associated with operations outside the United States; and other factors listed from time to time in the Company's filings with the Securities and Exchange Commission. The Company expressly disclaims any obligations or undertaking to release publicly any updates or revisions to any forward-looking statements contained herein to reflect any change in the Company's expectations with respect thereto or any change in events, conditions or circumstances on which any statement is based.
Visit our website www.euroseas.gr
|
Company Contact |
Investor Relations / Financial Media |
|
Tasos Aslidis |
Nicolas Bornozis |